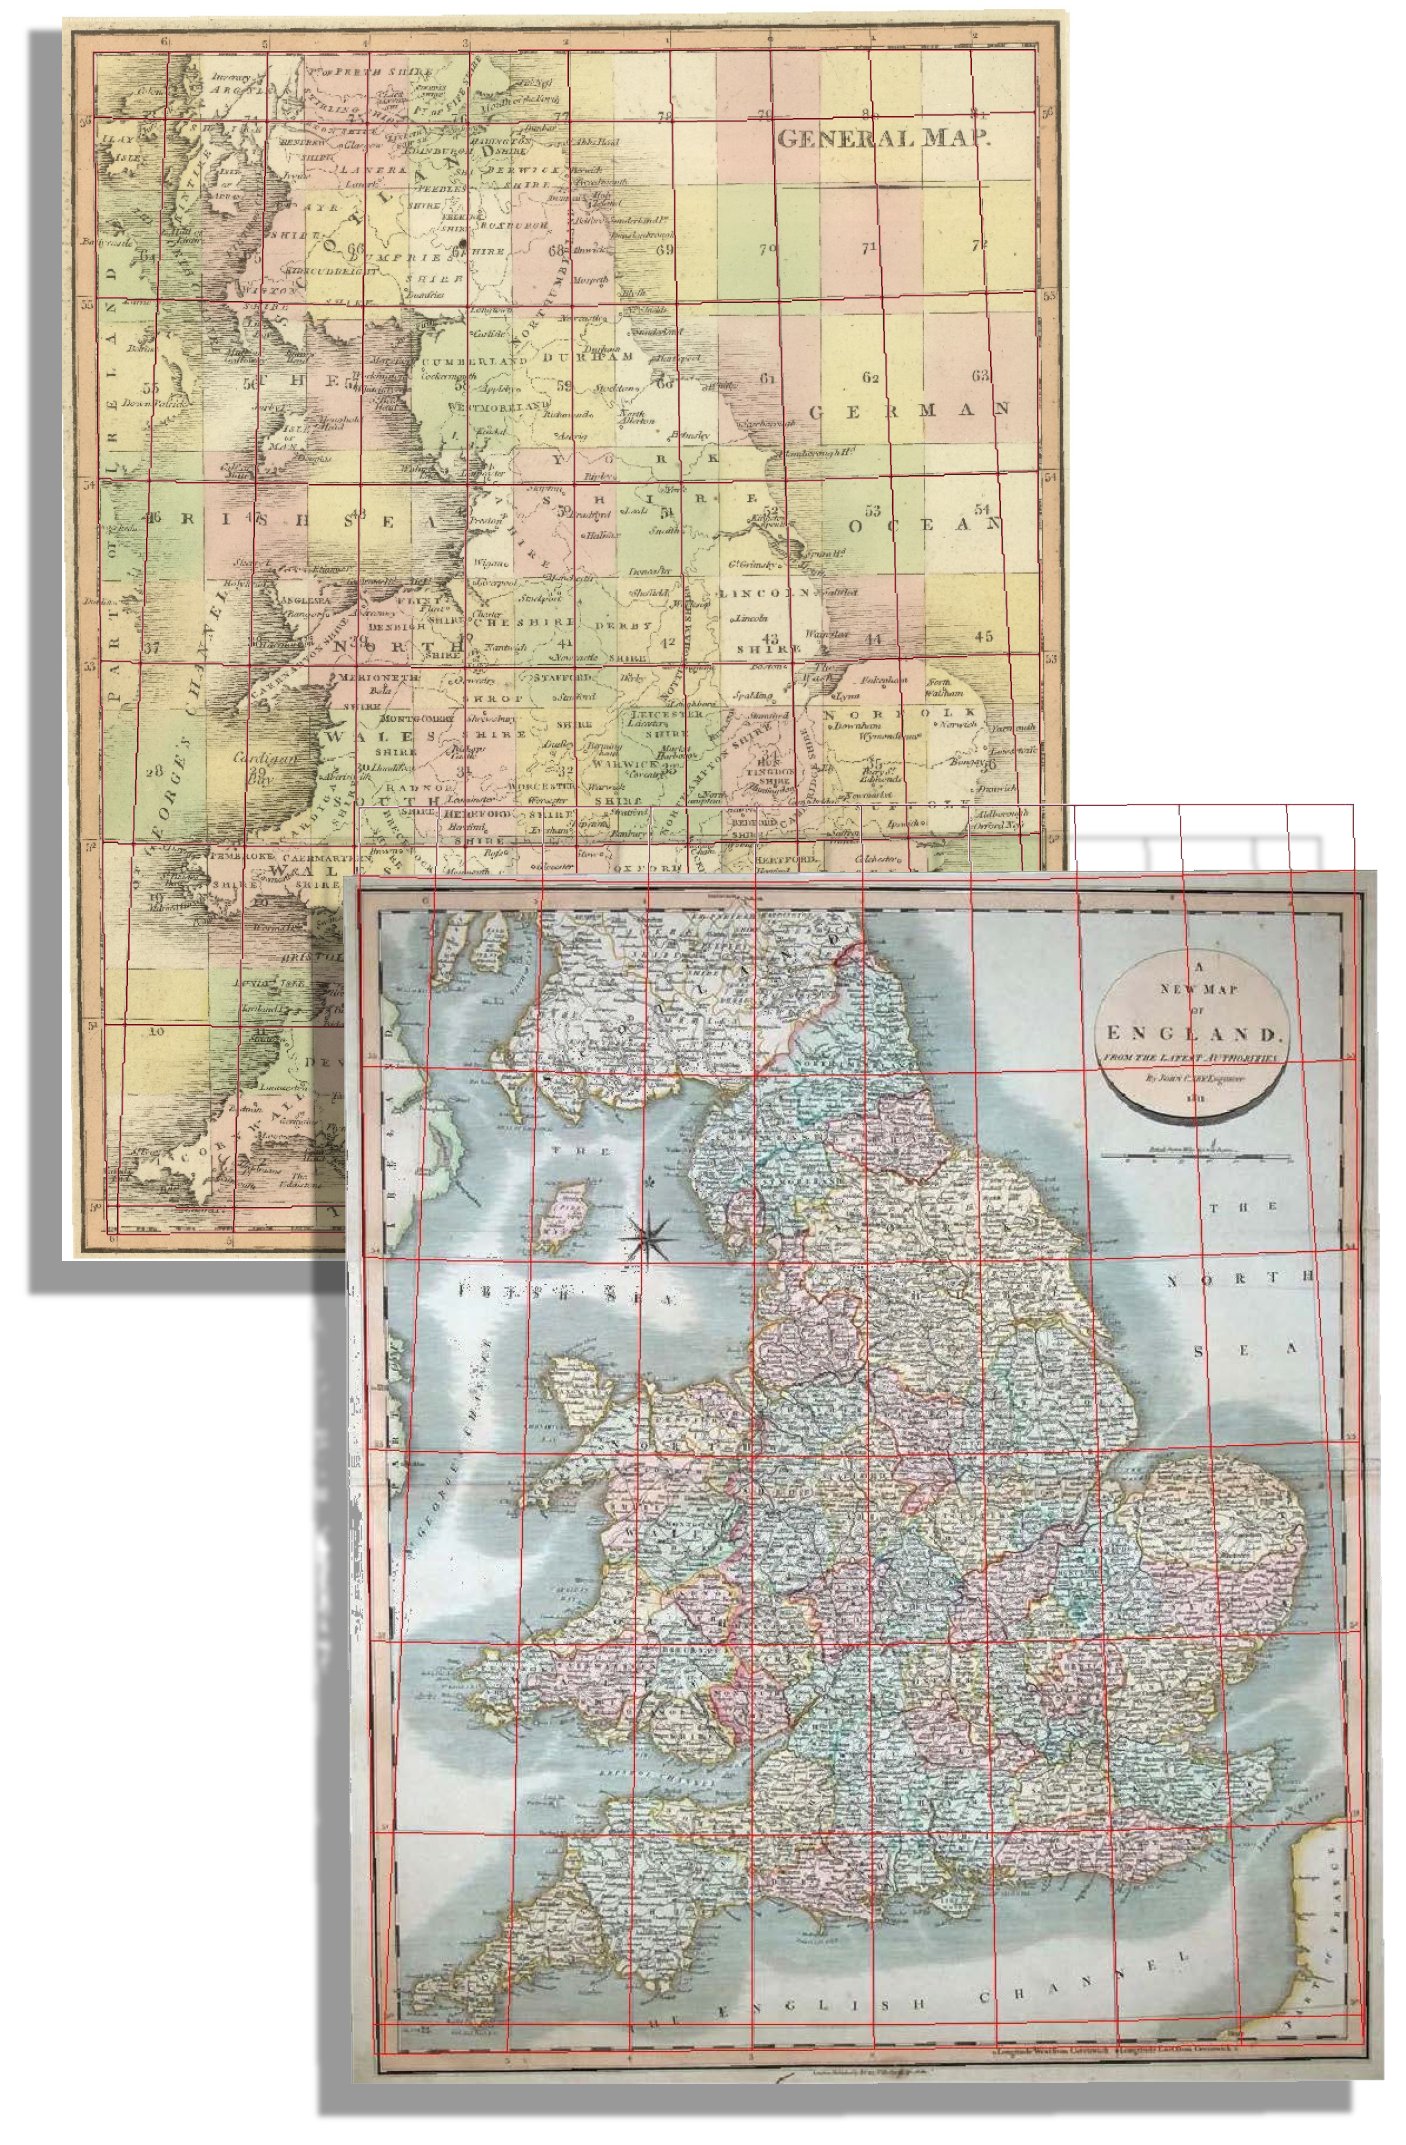
Internal lines of longitude and latitude do not occur on Cary’s New County Maps, only a framing graticule. However, the General Index Map for Cary’s 1794 New Map of England and Wales and Part of Scotland does have internal longitude and latitude lines, as does the New Map of England (1811) which was sold as a summary map with the New County Maps. The red grid is in 1°longitude and latitude in a Cassini projection. When transformed, both maps show a good fit to this projection and provide indirect evidence that the New County Maps may be in a Cassini projection.
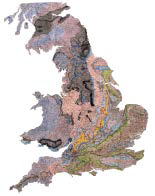
In order to get some more information on the coordinate system used for the New County maps and their accuracy, nearly two thousand longitude and latitude points, at an interval of 5 minutes, were plotted from the framing graticules of all published New County maps. The map (1) shows these points. When the New County maps were transformed to real world coordinates (Cassini) based on georeferencing to modern towns and villages, the graticule points became distorted to a greater or lesser extent (see Map2). The residual (RMS) error in metres, generated for each county is shown on the large coloured map. The general trend shows the best fit to be in the central and south east England, with errors increasing to the north and to the west. The same general trend is seen in longitude and latitude plots shown in maps (A) and (B).
