Definition of Stratigraphy
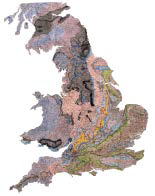
Stratigraphy is a part of geology concerned primarily with layering in sedimentary rocks (and to a limited extent in some volcanic rocks). Nicolas Steno (1638-1686) is generally credited with defining some of the principles of stratigraphy, specifically the law of superposition which, put simply states that in undisturbed strata the youngest layer is on the top and the oldest layer is on the bottom. There are two main elements of stratigraphy; lithostratigraphy, which is related to rock units and biostratigraphy, which is based on the fossils within strata. The first practical application of stratigraphy was made by William Smith. Smith never used the term “stratigraphy” but he applied its principles in his 1815 map of England and Wales and his later geological cross-sections which he made across the country.
Previous work and possible influences on Smith
It would be incorrect to assume that William Smith invented stratigraphy in England and Wales. It is certain that he would have been influenced by the work of others. These would have included John Strachey’s Observations on the Different Strata of Earths and Minerals, more particularly of such as are found in the Coal Mines of Great Britain (1727). Strachey made some very accurate observations of the sequence and attitude of coal beds and associated strata in coal fields at Stowey and High Littleton. In the cross-section illustrated below he shows the coal seams below the Red Earth. Interestingly, Strachey also shows another section at right angles to the first section where the drift of the coal seams appears horizontal. From this it is apparent that Strachey appreciated the different geometries of dip and strike sections. Smith was involved in a number of underground surveys for Lady Elizabeth Jones at her estates at Stowey, which were adjacent to John Strachey’s family home at Sutton Court. It is known that Smith possessed a copy of Strachey’s cross-section and was bound to have been influenced by Strachey’s work of some 80 years previously. Also, this may well have influenced him at a later date when he started to construct his own geologic cross-sections.
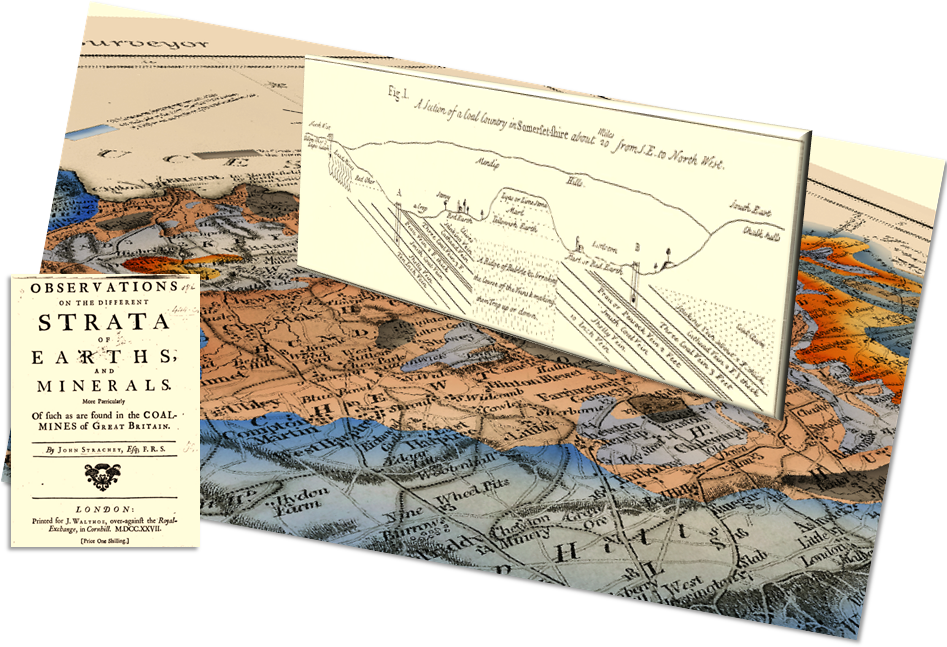
Cross-section (reversed to fit map) from John Strachley: Observation of the different strata of earths and minerals (1727) shown on the reconstructed Smith Somerset Map
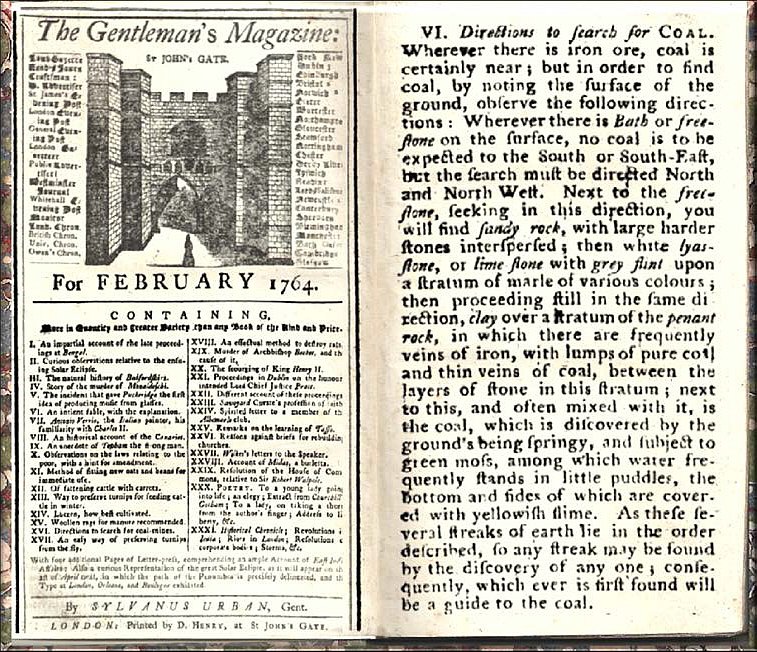
Another possible forerunner of Smith made a contribution to the Museum Rusticum using the pseudonym Ruricola Glocestris. This short article (see the reprint in the Gentlemen’s Magazine, 1764) outlines how the presence of coal in south Gloucestershire might be inferred. The author, identified by Hugh Torrens (2003) as John Player (1725- 1808), states that wherever there is Bath or freestone on the surface coal is not to be expected to the South or South-East [of it]. He then describes the progressively older strata encountered to the north and northwest. Player clearly illustrated that, in 1763, he already had a clear understanding of how regularly stratified the rocks in this area were and how this could be a guide to future coal seeking (Torrens 2003). It is not known if William Smith ever read this article or corresponded with Player at a later date, but we do know of other instances where Smith was familiar with older literature.
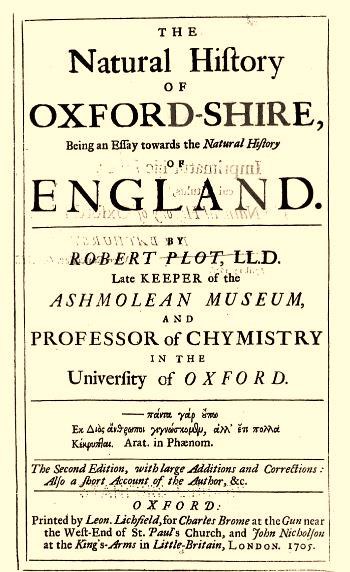
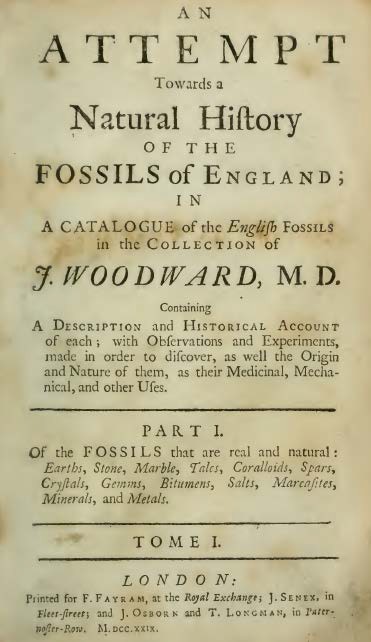
According to John Phillips in his Memoirs of William Smith, Smith turned to a number of previously written texts in order to reinforce and strengthen his general view. Phillips notes in particular Plot’s Oxfordshire, Morton’s Northamptonshire and Woodward’s Catalogue of Fossils. Smith would probably have viewed these books essentially as data sources, drawing from them description of fossils and locations of various strata rather than being influenced by outlandish theories as to the origin of the fossils and minerals, particularly those put forward by Plot and Woodward.
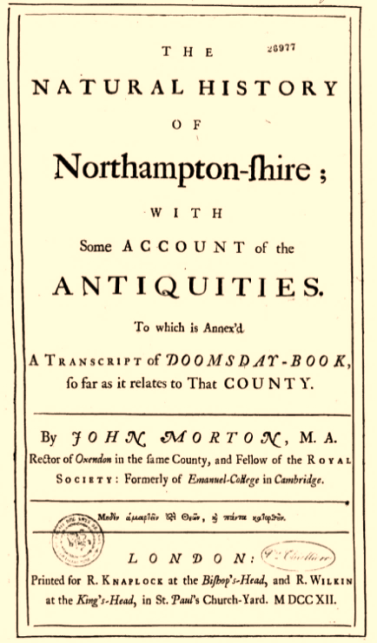
John Morton Natural History of Northamptonshire (1712)
The rocks of Northamptonshire would have been of particular interest to Smith as they are entirely Jurassic, ranging in age from Lower Liassic to Oxford Clay and Kellaways. Although Smith’s County Geological Map of Northamptonshire was never published, the manuscript version is almost complete. On his map, Smith notes the presence of the Barnack Rag and the Collyweston slate, both of which were previously described by Morton. John Morton provides detailed foot-by-foot descriptions of a number of Jurassic sequences which he describes from quarries and pits across the county. He was a keen observer, often noting textures, grain-size and cements of the rocks described. He was certainly able to recognize and describe the oolitic structures seen in some of his rags and freestones. He also describes in some detail the various joints and fissures seen in quarry sections and the nature of the material infilling them. Importantly, Morton makes mention of the “Situation” and “Order of the Strata”. Smith would also have been interested in Morton’s description of the fossils he encountered and had illustrated. The fact that Morton showed fossils with their location and associated lithologies would have been of great help to him. The illustrations below show Morton’s description of the (Inferior Oolite) sequence of strata at the Welden quarry. The bottom illustration shows some beautifully illustrated ammonites from the Liassic in the Clipstone pit.


Geological maps pre-dating Smith
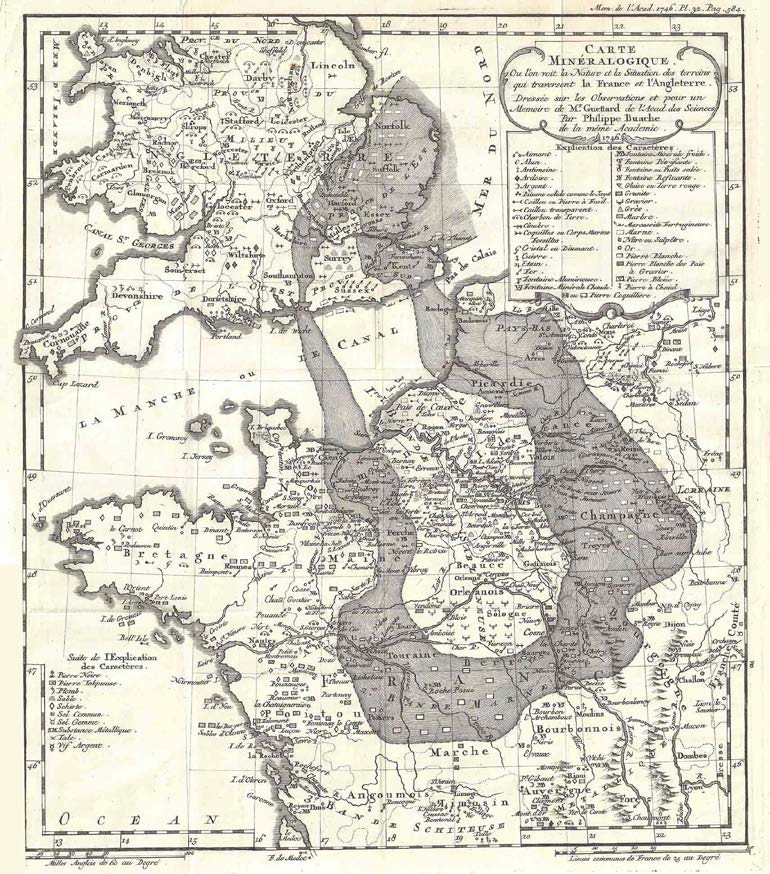
William Smith was not the first to attempt a country-wide geological map. The map (A) reproduced below is by Jean-Étienne Guettard (1715-1786) and Philippe Buache (1700-1773), published in 1746. The map contains a large amount of regional lithological information and significantly shows an attempt at the distribution of the chalk in France and England and by implication strata both older and younger than the chalk. The Mineralogical map (B) is by Guettard and Lavoisier (~1770) and is from the Atlas et Description Minéralogique de la France (No 5). This map shows point locations of a number of rocks and minerals as well as two stratigraphic sections (an idea credited to Lavoisier); no attempt was made to map strata. Map (C) entitled Mineralogical map of the Western Counties of England was published by William George Maton (1774-1835) in 1797. This map shows not only the distribution of igneous rock but also the distribution of the metamorphosed country rock (killas) and a number of other lithologies. Maton notes that his geological and mineralogical references were summarized “in a manner of a map, by which a general idea of the several transitions of substances may be obtained at one view”. Mather (Geoscience in South-West England, Vol. 13, Part 2, 2013) considers “that his map, although rudimentary and inaccurate is of considerable historical significance.” We do not know if Smith ever saw or was influenced by these early maps.
A
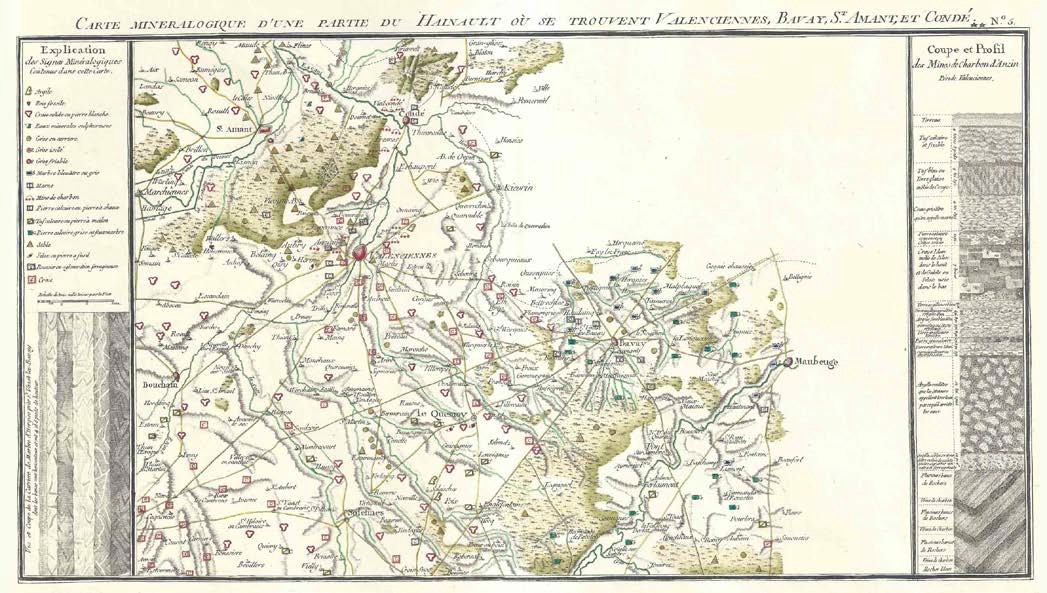
B
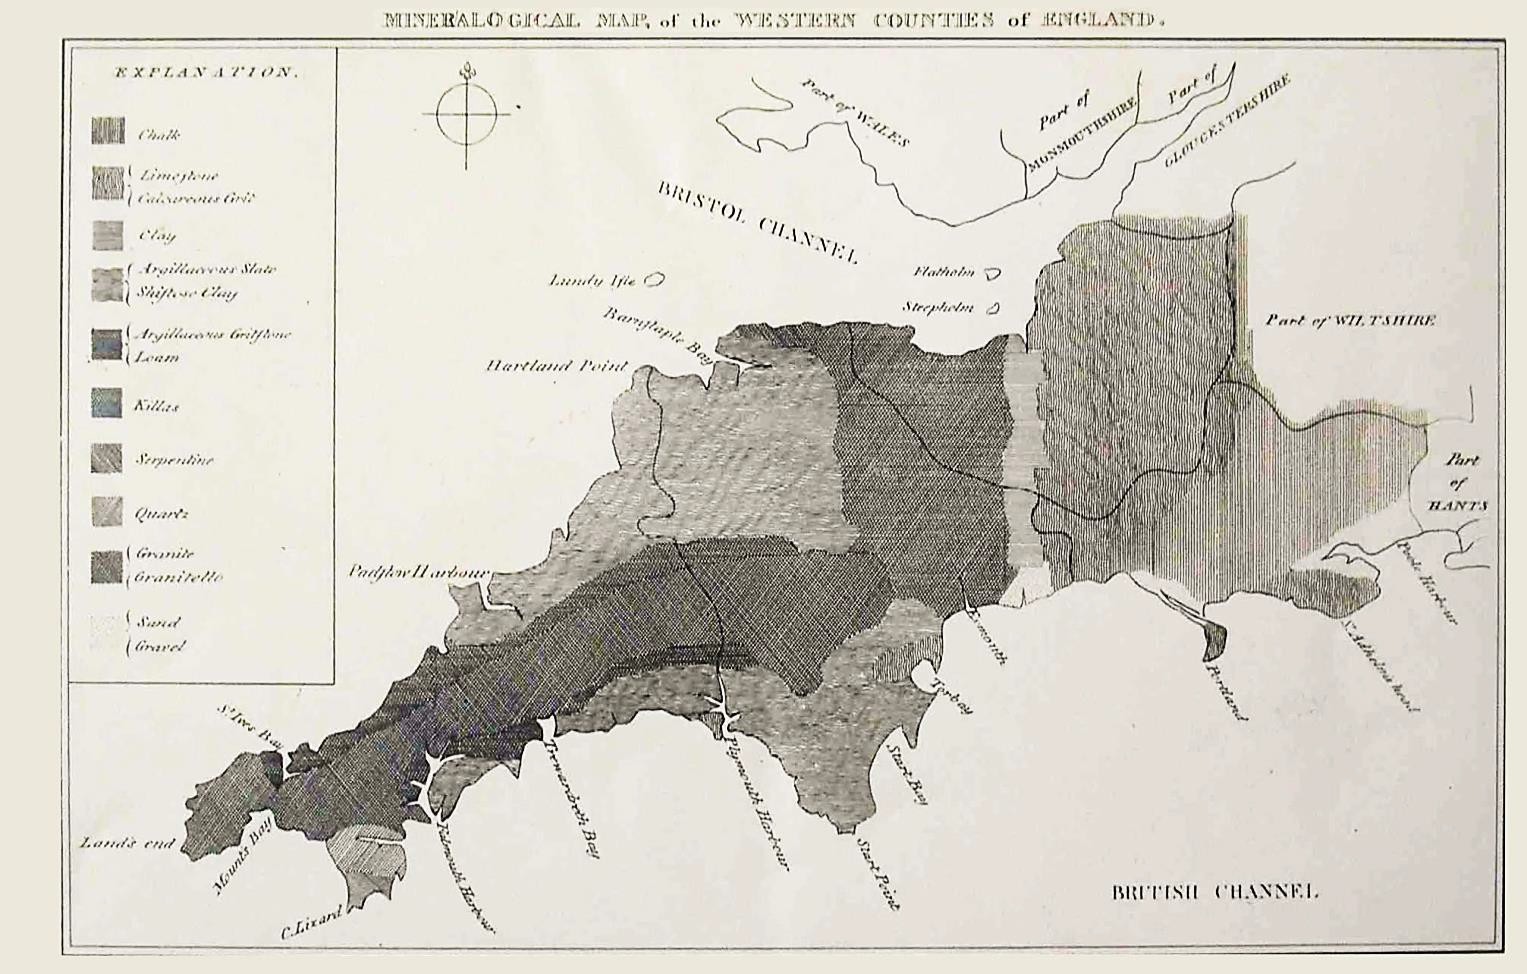
C

Maps reproduced with permission of Dave Williams
Smith’s Ordering of Strata
The Somerset Coal Canal played an important role during Smith’s formative years. Smith surveyed routes for the canal in 1794 and would have been concerned with excavations which started in 1795. In an era before motorway and railway cuttings, canal excavations were an ideal way to see vertical sections through strata. In Smith’s case he also had the advantage of seeing comparable sections in the two branches of the canal and also he knew the precise level of the canal cuttings. By the end of 1795 he had deciphered the local order of strata from the Great Oolite down to the Triassic “Red Ground”. Today it is easy to underestimate what an achievement this was. Smith had managed to separate several repetitious clay formations and also to separate the Upper and Lower Oolite. By August 1797, Smith had made his first attempt at a more general order of strata starting with Number 1 “Chalk Strata” and descending to Number 28 “Limestone” below the Coal Measures. In June 1799, at the home of the Revd Joseph Townsend, Smith dictated his famous “Order of the Strata in the Bath area” to the Revd Benjamin Richardson and during the course of several iterations it evolved into the geological table shown below.
![Smith’s Geological Table of British Organized Fossils This table, with a stratigraphic column coloured to match the 1815 map, includes columns referring to the Names of Strata on the Shelves of the [i.e. Smith’s] Geological Collection, the Names in the Memoir and the Peculiarities of the Strata, the Products of the Strata, and the Organized Fossils which Identify the respective Strata.](http://www.strata-smith.com/wp-content/uploads/2015/02/image466.jpg)
Smith’s Geological Table of British Organized Fossils
This table, with a stratigraphic column coloured to match the 1815 map, includes columns referring to the Names of Strata on the Shelves of the [i.e. Smith’s] Geological Collection, the Names in the Memoir and the Peculiarities of the Strata, the Products of the Strata, and the Organized Fossils which Identify the respective Strata.
Lithostratigraphy and Biostratigraphy
Like others before, Smith could recognise strata based on their lithology, some rocks e.g., oolites being very distinctive. However the problem with a purely lithological approach to stratigraphy can be the incorrect correlation of strata of differing age but with similar lithology. Smith knew this and realized the importance of the fossil record early on in his career. He was an avid collector of fossils but unlike the genteel collectors in Bath, did not see them as ornaments. In 1796 he wrote ”Fossils have long been studied as great curiosities, collected with great pains, treasured with great care and at a great expense, and shown and admired with as much pleasure as a child’s rattle or a hobby horse is shown and admired by himself and his playfellows, because it is pretty; and this has been done by thousands who have never paid the least regard to that wonderful order and regularity with which Nature has disposed of these singular productions, and assigned to each class its peculiar stratum”.
To him they were a key tool to identify and type specific strata in the geological record. He built up a huge collection of fossils which he could relate to specific strata. Based on this, it can be fairly said that he founded the science of biostratigraphy.
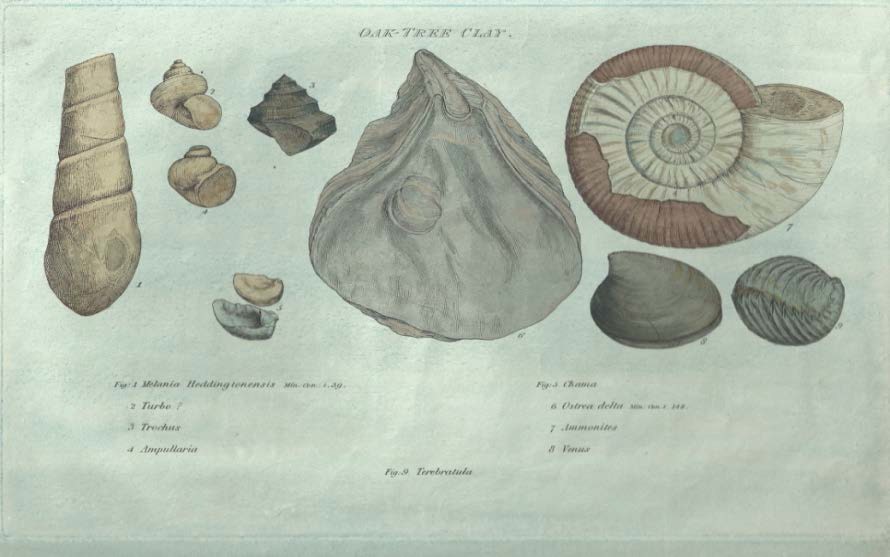
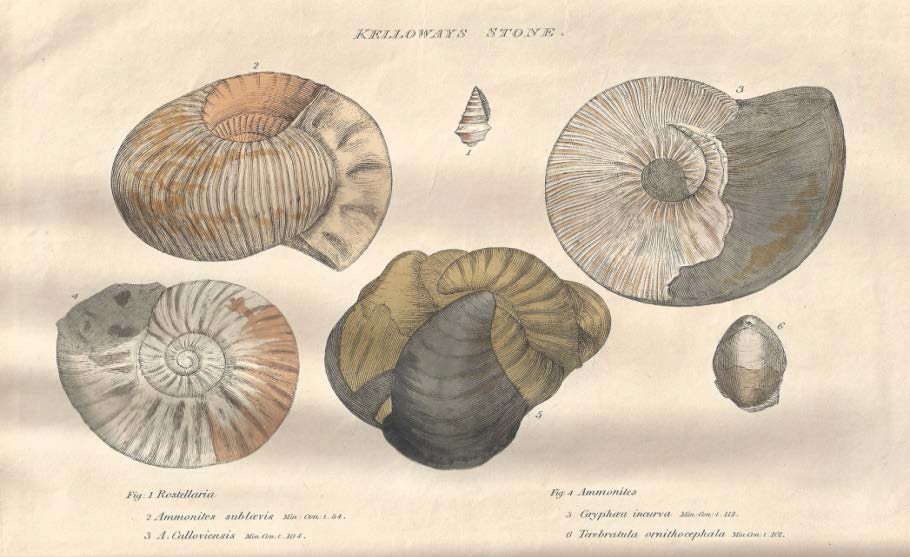
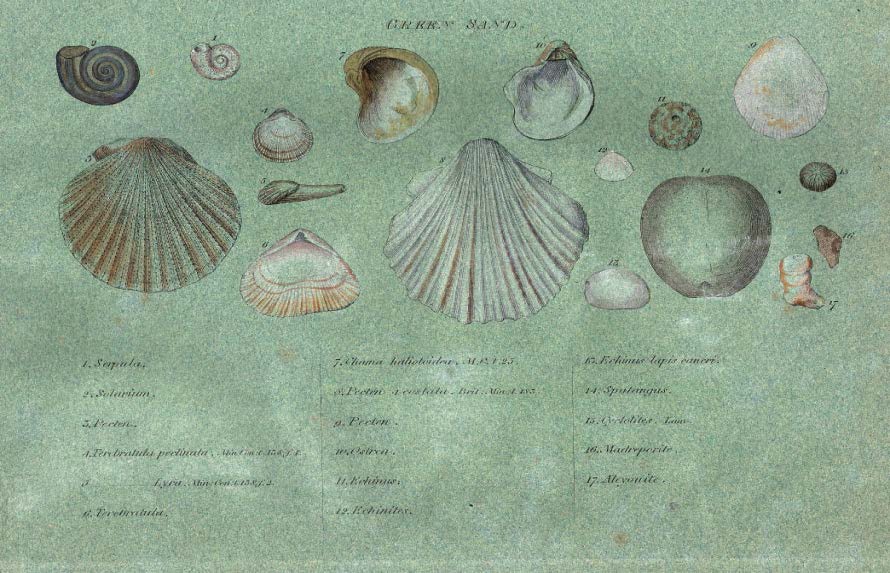
Strata Identified by Organized Fossils, containing Prints on Colored Paper of the most characteristic specimens in each Stratum by William Smith (1816-19). Examples shown are from the Oak Tree Clay, Kelloways Stone and Greensand
Smith’s practical approach to stratigraphy (maps and cross-sections)
William Smith was no theoretician, he was a practical man who realized early on that there were real commercial advantages to be gained from an understanding of stratigraphy. Today we think of its commercial application primarily in oil and gas exploration; in Smith’s day exploration for coal and other minerals was important but also the distribution of strata was extremely relevant in agriculture, for the type and quality of soil encountered is often determined by the underlying strata.
Smith’s initial problem was how best to show the distribution of his strata on maps. Should it be by point locations, lines or colours? As we know Smith chose a combination of both line and colour. His colours generally had some lithological significance and indeed are still used today. Smith also used graded tints on his maps with the strongest colour at the base of the bed at outcrop lightening upwards (see below). This is what Smith says in his memoir to the map. “The Society of Arts very wisely foresaw, in offering their premium for a mineralogical map (which I have just had the honour to obtain), that one of the greatest difficulties in understanding such an extensive branch of natural history arose from the want of some method of generalizing the information, which could only be supplied by a map that gives, in one view, the locality of thousands of specimens. By strong lines of colour, the principal ranges of strata are rendered conspicuous, and naturally formed into classes, which may be seen and understood at a distance from the map, without distressing the eye to search for small characters. This is the advantage of colours over any other mode of representation”.

The effect of Smith’s striking colouring technique also serves to give added depth to the two dimensional plane of the map; the individual strata appear to have a measure of three dimensional relief which makes their relationship to one another more apparent. Another method used by Smith to demonstrate the relationship of strata to one another was the geological cross- section. Although the origins of the geological cross-section date back to John Strachey, Smith took cross-sections to a new level. His section from London to Snowdon (shown above) is a geological masterpiece, a combination of cross-section and panorama.
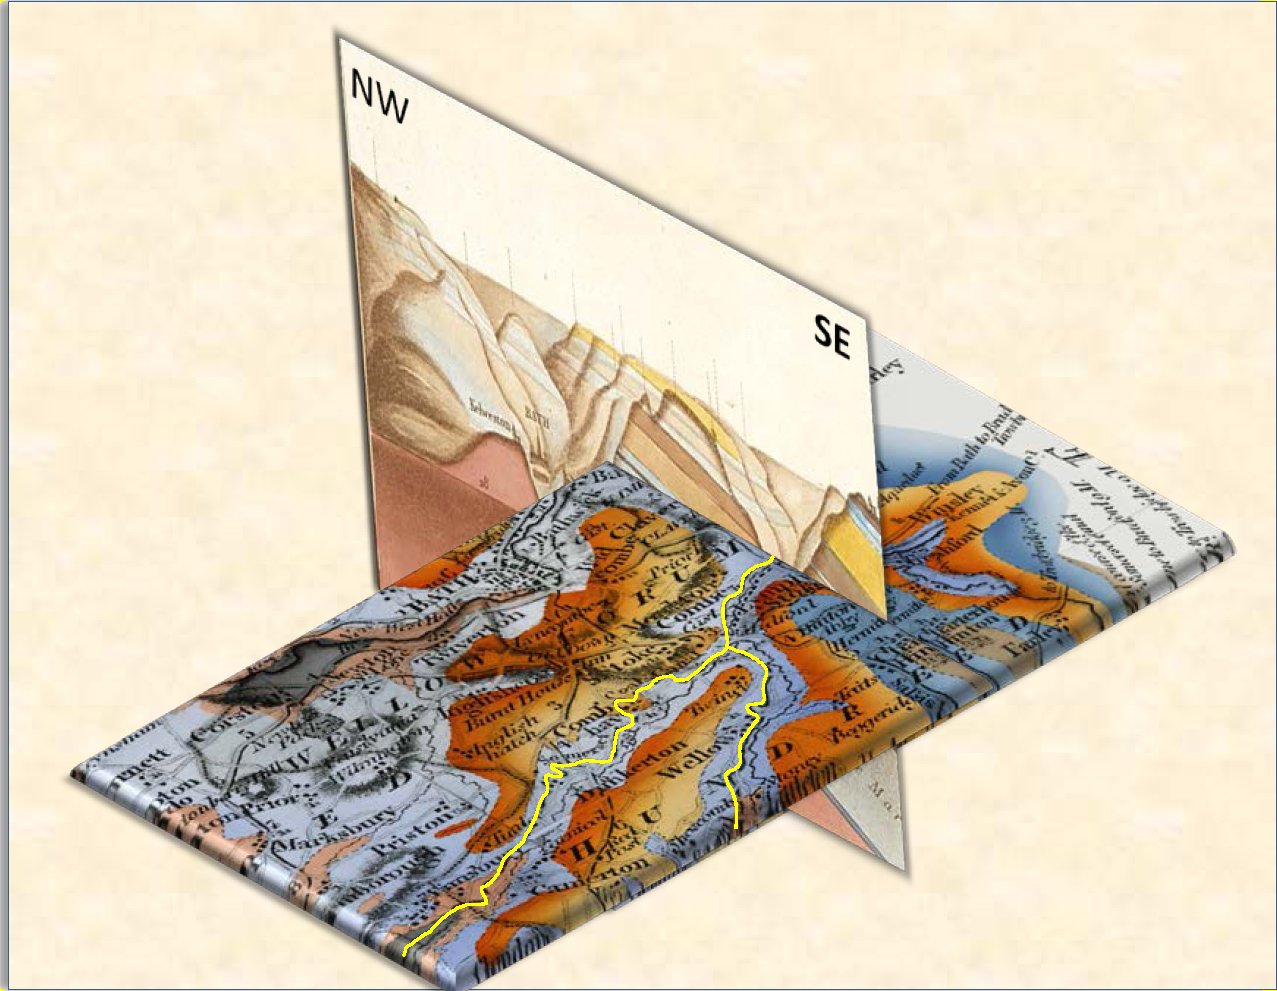
Geological map (based on Smith) in the region of the Somerset Coal Canal (yellow) together with part of William Smith’s Bath to Southampton geological section showing the NW-SE dip of strata (the steep dips are due a x50 vertical exaggeration)
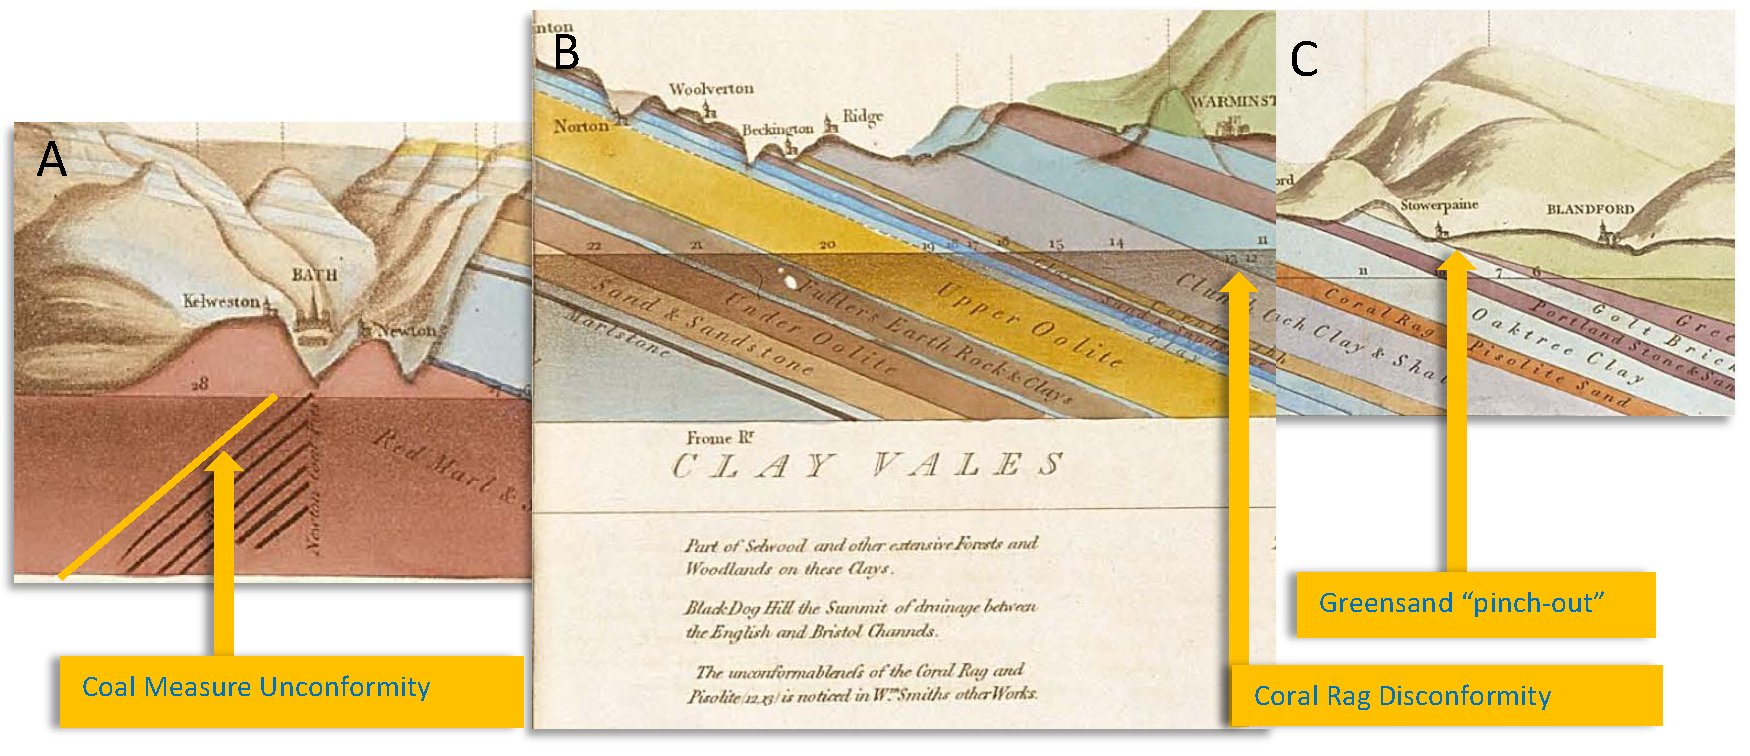
When these sections are looked at in more detail, Smith demonstrates his understanding of other geological features. Although Smith believed that the dip he saw in the strata was contemporaneous with sedimentation, he recognized a sharp angular unconformity (A) between the “Red Ground” and the Coal Measures with the implication that there was also faulting separating the two. In the section (B) he shows a disconformity between his Clunch (Oxford) and Oaktree (Kimmeridge) clays resulting in the absence of the Coral Rag. In (C) he shows the Greensand beneath the Chalk pinching out eventually resulting in an unconformity between the Golt (Gault) and the Chalk.
The illustration to the right combines part of Smith’s Bath-Southampton section with part of his reconstructed Somerset County map in the area of the Somerset Coal Canal. The section shows the NW-SE dip of the Middle and Lower Jurassic rocks across the area. On the map the two branches of the canal are shown cutting through progressively older beds in a SW direction with the northern branch encountering Coal Measures near Paulton.
Modern stratigraphy
William Smith laid the foundation for stratigraphy in England. Later his pioneering work was to be continued by others. Of note were Carl Albert Oppel and Alcide d’Orbigny. Oppel provided a detailed zonation of the Jurassic by use of ammonites and was able to subdivide the Jurassic into 33 different zones. The results of his researches were published in his great work Die Juraformation Englands, Frankreichs and des südwestlichen Deutschlands (1856-1858). For the first time Oppel showed that it was possible to correlate Jurassic deposits across Western Europe independently of their lithology. Oppel was a great admirer of d’Orbigny, the great naturalist and palaeontologist. It was d’Orbigny who originated the stage name as a chronostratigraphic unit consisting of a number of faunal zones. Techniques have evolved which have refined biostratigraphic zonation specifically through the science of micropaleontology. Micropaleontology is divided into four areas of study based on microfossil composition: (a) calcareous, as in coccoliths and foraminifera; (b) phosphatic, as in the study conodonts and some other vertebrates remains; (c) siliceous, as in diatoms and radiolaria; (d) organic, as in the pollen and spores studied in palynology. The use of microfossils has greatly extended biostratigraphic zonation since many occur in lithologies which would not normally be regarded as fossiliferous.
Also as the concept of facies and depositional environments evolved so more became understood about the origin of the various stratigraphic units.
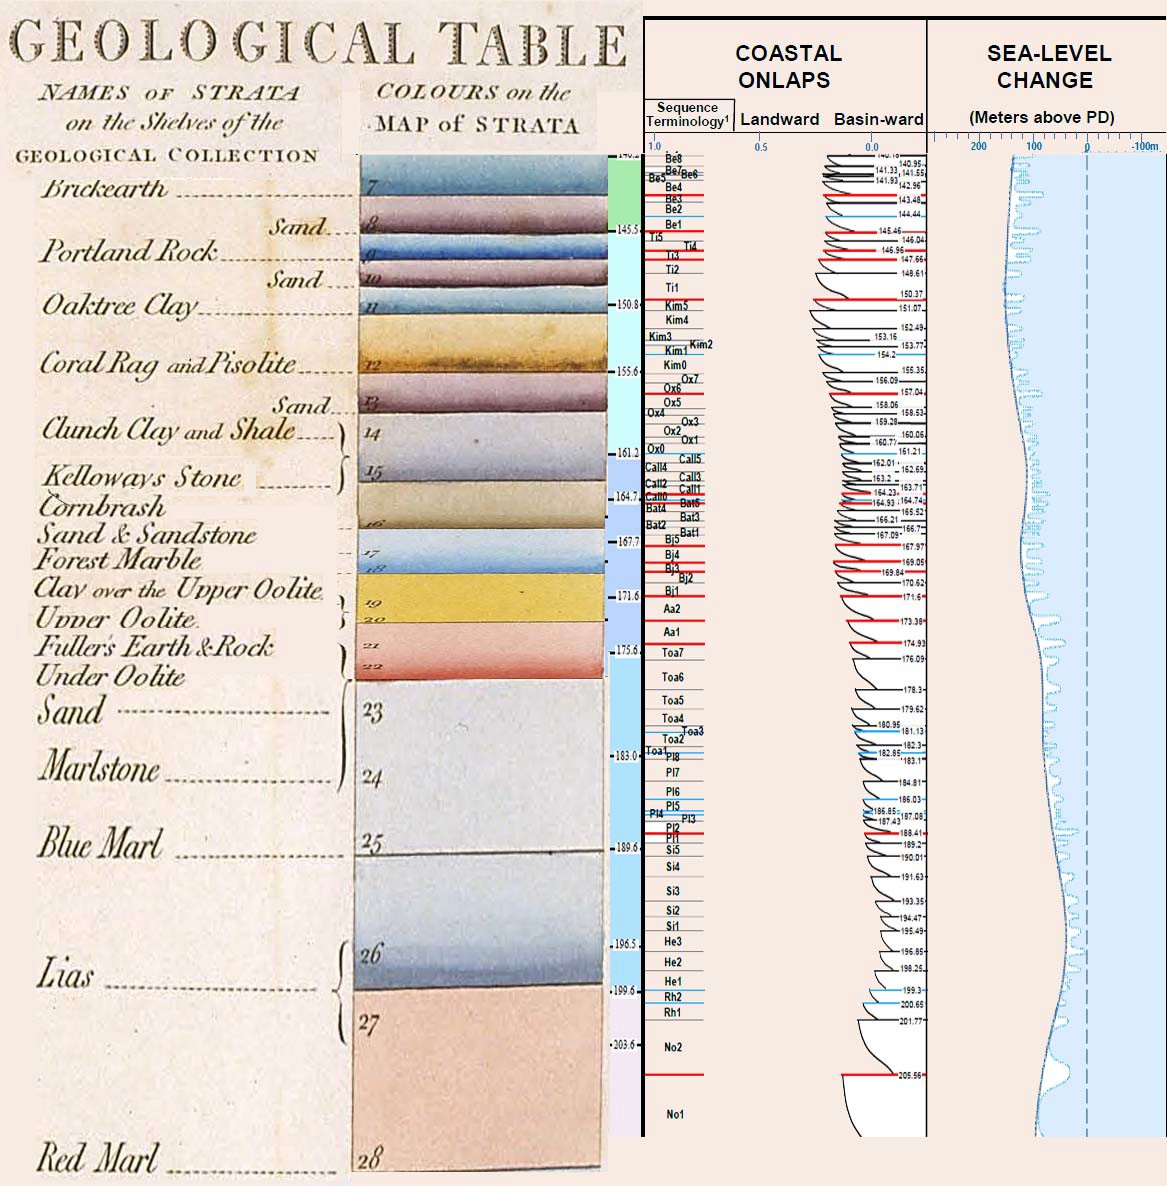
Part of William Smith’s Table of Strata shown in comparison with modern stratigraphic sequences and sea-level curves, red = major sea-level change, blue = minor sea-level change, modified from John W. Snedden and Chengjie Liu (2010) (Exxon)
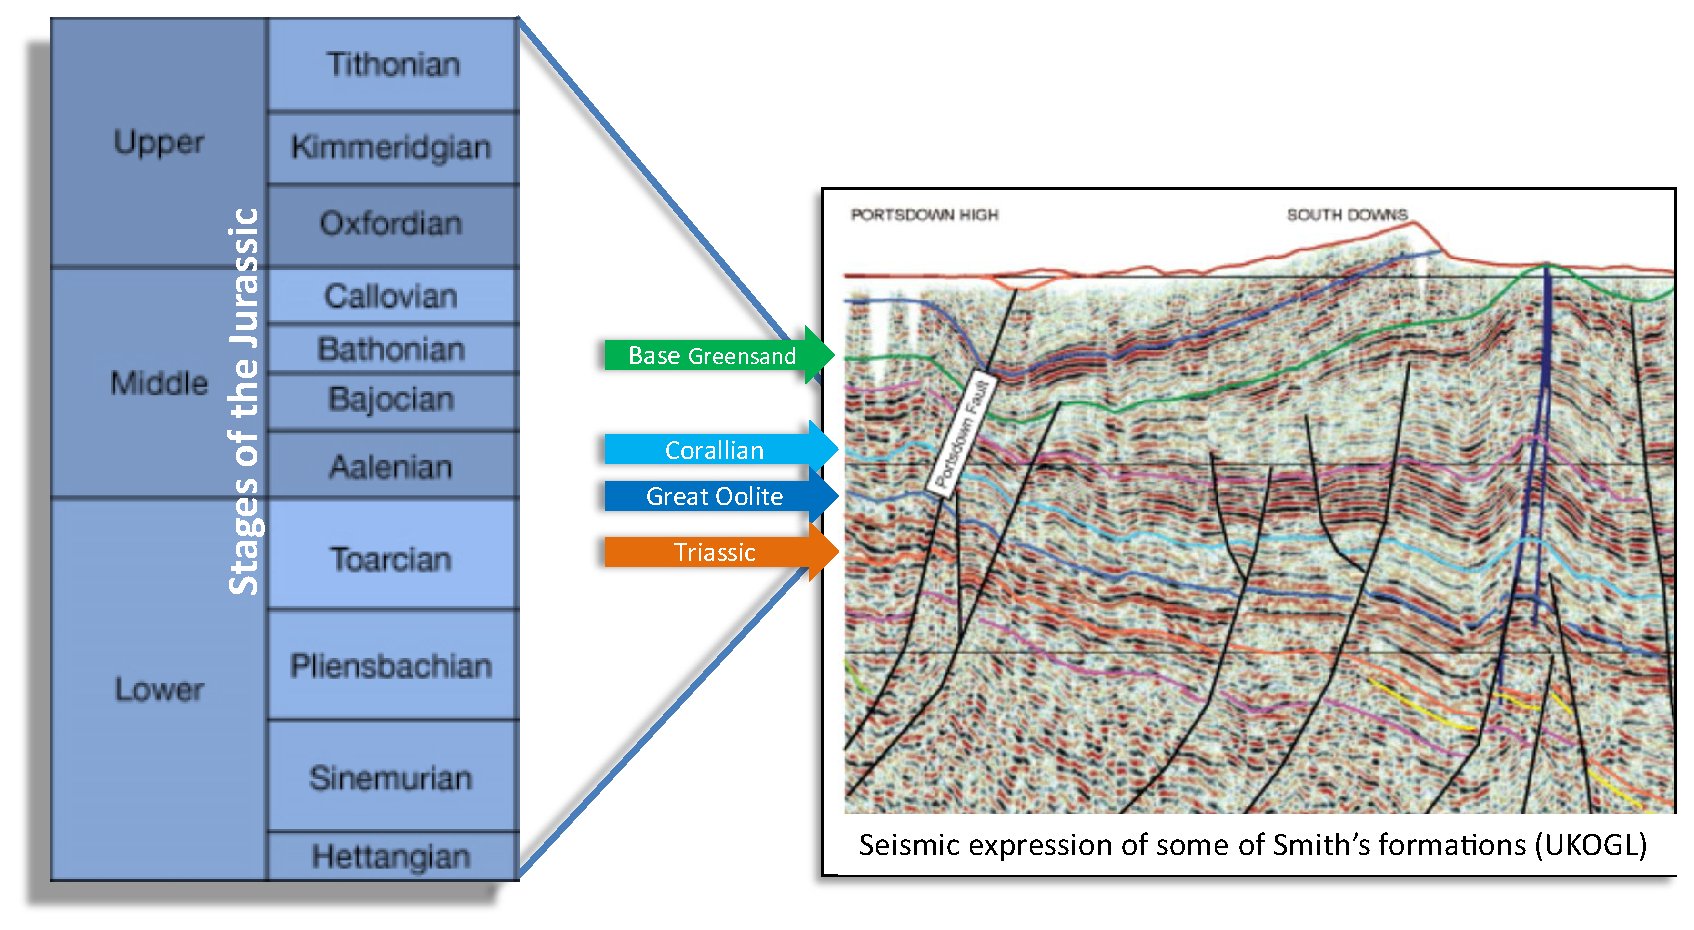
A major revolution in the understanding of stratigraphy came in the late 20th century with the advent of high resolution seismic acquisition. For the first time it became possible to resolve individual stratigraphic units and to understand their architecture; from this the concept of sequence stratigraphy has emerged.
A depositional sequence is a relatively conformable succession of related strata bounded above and below by subaerial unconformities or their up-dip correlative conformities. A subaerial unconformity is a surface formed by subaerial exposure and erosion. Each depositional sequence represents a cycle of relative sea-level change and will contain parasequences with facies occurring in a predictable order (often coarsening-upwards). Within a depositional sequence there are a number of system tracts. Several models have been proposed to describe these tracts. One of the more popular is a four systems tract model in which the depositional sequence contains:
Lowstand systems tract (LST)
Transgressive systems tract (TST)
Highstand systems tract (HST)
Falling-stage systems tract (FSST)
The sequence begins with the slow rise in sea level following a fall which continues through to the next fall in sea level. The systems tracts are bounded by important surfaces. Lowstand and transgressive systems tracts are separated by the transgressive surface. Transgressive and highstand systems tracts are separated by the maximum flooding surface.
Highstand and falling-stage systems tract are separated by a basal surface of forced regression.
The science of stratigraphy has made significant advances during the past 200 years, yet for all these advances there is a direct link back to William Smith’s original work. All those who use stratigraphy professionally, either in the commercial world of hydrocarbons exploration, or in academia, owe Smith a enormous debt of gratitude and it is important that his contribution continues to be acknowledged and remembered.
